Friday, August 18, 2023

How many stars can you see in the Great Square of Pegasus?

The time for the Perseid meteor shower has been and gone (the peak was on the 12/13th August) and I missed out as it was cloudy that night here in Norfolk. The following night at 1.15am BST on the morning of the 14th August I did have a peep outside and was presented with a really clear dark sky that you just don't see that often. Jupiter is now up at this time and it won't be long before it is in our evening sky again. What interested me was just how good the sky transparency was. One of the ways of testing this is to try and see how many stars you can make out with the naked eye within the Great Square of Pegasus which was well placed at this time. This is a good test of your eyesight and a good test of how dark your sky really is. I could see quite a few stars so I decided to spend some time totting them up.

Bob King has described his attempts at doing this in his very good Sky and Telescope article. In the end I counted 9 or 10 and using his list of stars within this asterism I reckon that I was seeing down to magnitude 5.8 which is pretty good.

I used to think we had good dark skies where we are in Norfolk but over recent years I have had to admit that light pollution is getting worse where we are. We have Norwich just about 10 miles away and the lights from this city are getting worse as it expands further out towards the NDR. To the east is Great Yarmouth but that only shows up faintly. Nearby we have some intrusive lights from a local radar station to the north.

When I realistically place our night sky on the Bortle Scale I can see that we are actually approaching a suburban sky (class 5). On better nights we might just be classed as a 4 (rural/suburban transition) but I think that is pushing it as evidenced by the fact that I couldn't see stars fainter than 6th magnitude. I certainly have never seen the Zodiacal Light here and I did try to see M33 with the naked eye but didn't spot it. However, this may be something to try on another dark night. 

All text and images © Duncan Hale-Sutton 2023

Monday, May 29, 2023

The General Catalogue of Variable Stars

An online version of this catalogue can be seen here. I wanted to use this catalogue to confirm that the stars I have referred to as X and Y in the field of the variable star Z Ursae Majoris aren't variables in themsleves. This would pose a problem to using them as comparison stars if they were.

Star X is HIP57820 and is also known as HD102956 or Aniara. If you click on the GCVS query form you can use the cross-identification to select the HIP (Hipparcos) catalogue and enter the number 57820. No record is found which I take to mean that this star is not a variable.

The same can be said of star Y which is HIP58302 also known as HD103810. Now Z Ursae Majoris is HIP58225 and this brings up the record for this variable star.

All text and images © Duncan Hale-Sutton 2023

Saturday, May 27, 2023

Z and RY Ursae Majoris and TX and AH Draconis (15/5/23)

We have had a more settled period of weather in the last couple of weeks giving some good clear skies. Monday before last (15th May) was one such night and the moon at 3 days past last quarter wasn't due to rise until 02:58 UT. Astronomical twilight was predicted to end at 23:00 UT. I thought I would get some more estimates for the semi-regular variables I monitor in Ursa Major and Draco.

Beginning with Z UMa and using BAA chart 217.02 at 22:15 UT I could see star H which is magnitude 8.7. This was a good indication of my limiting magnitude. I noted at 22:21 UT that Z was brighter than star D (=7.9) and star C (=7.5). In fact, on closer inspection, at 22:31 UT I thought it was pretty close to star B (=7.3) in brightness but perhaps one tenth brighter. This made it B+1 or magnitude 7.2.

Using the same chart I looked at RY UMa. RY was fainter than stars 1 (=6.7), 2 (=7.4) and 4 (=7.7) but not by much for the latter. At 22:50 UT my estimate for RY was one tenth fainter than star 4, i.e. 4-1 or magnitude 7.8.

Moving on to the stars in Draco. Beginning with chart 106.04 and TX Draconis. At 23:04 UT TX was brighter than star N (=7.7) but fainter than star K (=7.0) but not by much. My estimate was that it was 2 points from N and 1 from K, that is K(1)V(2)N or magnitude 7.2.

Finally AH Dra. At 23:11 I noted that AH was fainter than star 1 (=7.0) but at 23:25 I estimated it to be equal to star 2 (=7.3), that is magnitude 7.3.

I think all of these estimates are in reasonable agreement with other observers from the BAA.

All text and images © Duncan Hale-Sutton 2023

Friday, May 26, 2023

A re-estimate of the colour transformation to V for Z Ursa Majoris (7th May 2023)

I have previously had a go at transforming a green channel magnitude estimate from my DSLR camera to Johnson V and with the new data I obtained on the 7th May, I can repeat this process. Below is a graph of V-v against B-V for the new data:-

This is strikingly similar to the graph I obtained previously. The data points for the stars 84, X and Y have been marked. The straight line drawn through the points has been obtained by linear regression on a calculator. The gradient of this line is -0.170 (to 3 d.p.) and is very similar to the gradient of -0.186 obtained from the 2nd April data. So our transformation coefficient in this case is T = -0.170 and I can use this to transform our green channel magnitude estimates to Johnson V.

Our D(B-V) values are the same as before. In this case I find that T*D(B-V) is -0.114, -0.061 and -0.155 for the stars 84, X and Y respectively. Given that the green channel magnitudes for Z from these comparison stars were 7.349, 7.324 and 7.420 respectively, then the transformed Johnson V magnitude estimates for Z are 7.235, 7.263 and 7.265. The mean of these values is 7.254 +/- 0.017.

That night I had a go at estimating the magnitude of Z UMa using 7x50 binoculars. My visual estimate was 7.3 which is very close to this photometric observation. In all there were 3 visual estimates for this variable star from the BAA and AAVSO on the night of the 7th/8th May (including my own) which gave 7.23 +/- 0.12 in very good agreement with my transformed V estimate.

All text and images © Duncan Hale-Sutton 2023

Tuesday, May 23, 2023

A repeat photometric observation of Z Ursae Majoris (7th May 2023)

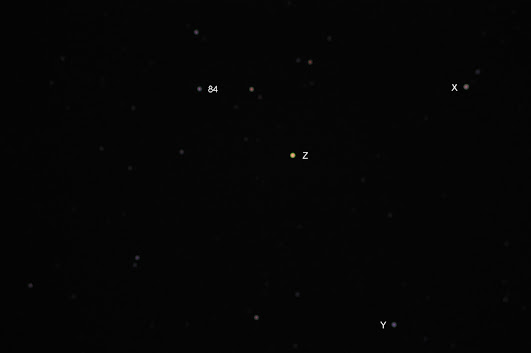
On the 7th May I was able take another image of the star field which includes the pulsating variable Z UMa. Like before this was a single 30s exposure at ISO 800 taken (at 21:33 UT) with my 102mm Celestron refractor using my Nikon D90 DSLR at prime focus. Here is the image:-

For comparison, here is the image I took on the 2nd April:-

There are a few things to notice about the differences between these two images; 1) Z and the comparison stars (apart from Y) occupy different positions within frame, 2) the stars in the latest frame are slightly sharper, 3) the background sky in the latest frame is darker. On both occasions the variable star was close to being overhead in the sky when the image was taken (thus minimizing the effects of atmospheric extinction).

I have followed the same procedure as before in my calculation of magnitudes but with a slight modification. I used a circle of diameter 60 pixels rather than 70 pixels to measure the green channel flux of the stars. Then to measure the sky count around a star I used an annulus centred on the star with an inner diameter of 70 pixels and an outer diameter of 120 pixels.

Firstly for Z I found that the mean stellar count was 80.39 over 2828 pixels and the sky was 5.28 over 7452 pixels. This gave a sky subtracted stellar count of 80.39 - 5.28 = 75.11. As said before this all in the green channel. Measurements were done in Photoshop using circular selections and the histogram tool. Note that for the frame taken on the 2nd April, the sky count was 24.20 - so much brighter! This was because the moon was four days from full and well up in the sky.

For star 84 I determined that the stellar count had a mean of 31.82 (again over 2828 pixels) and the sky was 4.74 (over 7452 pixels). This gave a sky subtracted count of 31.82 - 4.74 = 27.08. So that the counts from Z and star 84 can be compared this count needs to be corrected for vignetting. For this I had taken 16 flat frames (ISO 800) with the camera still in the telescope and at the same focus. This was then combined into a master flat frame. Using a 100x100 selection box the count on the master had a mean of 187.39 at the position of Z and 184.32 at the position of star 84. The corrected stellar count for star 84 was therefore (187.39/184.32) x 27.08 = 27.53. Using this comparison star the magnitude of Z is therefore 8.438 - 2.5 log (75.11/27.53) = 7.35 (2 d.p.).

For star X I found the stellar count to have a mean of 48.07 and the sky to be 4.47 giving a sky subtracted count of 48.07 - 4.47 = 43.60. The corrected stellar count was (187.39/177.92) x 43.60 = 45.92. Using this comparison star the magnitude of Z was therefore 7.858 - 2.5 log (75.11/45.92) = 7.32 (2 d.p.). 

For star Y the stellar count was 34.11 and the sky count 4.42 giving a sky subtracted count of 29.69. The corrected stellar count was (187.39/178.50) x 29.69 = 31.17. Using this comparison star the magnitude for Z was therefore 8.375 - 2.5 log (75.11/31.17) = 7.42 (2 d.p.).

Hence, using all three estimates I found that the green channel magnitude for Z from my camera was 7.36 +/- 0.05.

This is interesting because on the 2nd April I had found that the magnitude for Z then was 7.38 +/- 0.05 - just 0.02 magnitudes different! This may look odd for a pulsating variable that should have varied more than this over this time until you realise that on the 2nd it was approaching maximum brightness whereas on the 7th (May) it was decreasing again. It just happens to be a coincidence. Note also that on the 2nd the individual estimates were 7.37, 7.34 and 7.44 (for 84, X and Y respectively) and on the 7th these were 7.35, 7.32 and 7.42 - there is exactly 0.02 magnitude difference here too! This is good news as it shows that the variations in the magnitude estimates are not arising from instrumental error but the instrinsic differences of the stars themselves. This in spite of there being differences in how the data was gathered (on different nights with different sky backgrounds, orientations of the stars on the frames and different degrees of focusing - see above).

All text and images © Duncan Hale-Sutton 2023

Saturday, May 13, 2023

Adding a colour correction term to my photometric estimates of the magnitude of Z Ursae Majoris

In a previous post I attempted to obtain an estimate for the magnitude of Z UMa by using a single 30s exposure taken on my Nikon D90 digital camera mounted at the prime focus of my Celestron NexStar 102mm telescope. This was the frame I took with Z and some other stars marked:-

Using the comparison stars 84, X and Y I was able to determine a magnitude estimate of Z of 7.37, 7.34 and 7.44 respectively. I now wondered if it was possible to use colour information about these comparison stars to try and figure out how to transform these magnitude estimates to a more standardised Johnson V system. I know it isn't much data but I thought it was worth having a go.

If you look at the DSLR observing manual of the AAVSO (it is a bit of a mighty tome, but bear with me) then on page 74 it shows how the response of the DSLR's blue, green and red channels differ from Johnson's B, V and Cousins R. Johnson V is supposed to mimic closely the visual response of the human eye. As you can see, a DSLR green channel has a peak which is similar in wavelength to V but it is narrower in response. Each different make of camera will have a slightly different response as a function of wavelength and this is why it would be an advantage to transform the camera's magnitudes to a more standard V system, if possible.

So how do you do this? If we ignore any extinction considerations for the moment (extinction is how a star's brightness is altered by passing through varying thicknesses of the earth's atmosphere) then we can to first order write that

V(Z) = m(Z) + T * D(B-V)

which is essentially equation 6.12 on page 74 of that manual. Here m(Z) is the magnitude of Z UMa determined using the relative brightnesses of Z and the comparison star measured in the camera. T is a transformation coefficient and D(B-V) is the B-V for Z UMa minus the B-V for the comparison star. B-V is the colour index of a star and simply the Johnson B magnitude minus the Johnson V magnitude.

We have already determined m(Z) above to be 7.368, 7.338 and 7.443 for stars 84, X and Y above, respectively. What we need is an idea of what T is and we need to know the colour indices for Z and the comparisons.

To obtain T we need to plot (V - v) against (B-V) (see equation 6.17 on page 76 of the AAVSO manual) for the comparison stars. V is again the Johnson V magnitude for the comparison star, B-V its colour index and v is an 'instrumental magnitude' given as

v = -2.5 log (brightness of comparsion star measured by the camera)

Hopefully, this should look like a straight line with gradient T. I had to glean the data that I needed from various parts of the internet. For star 84 we have V=8.438 and B-V=0.657. This comes from a plot of Z UMa from the AAVSO. Star X is HIP57820 on the Hipparcos catalogue and V=7.858 (see server3.sky-map.org). B-V=0.97 (see universeguide.com). Star Y is HIP58302 with V=8.375 (see server3.sky-map.org) and B-V=0.42 (see universeguide.com). Using this data and the brightness values for 84, X and Y previously obtained as 25.30, 42.01 and 28.73 respectively I was able to plot V-v against B-V:-

Even though I only have three data points (84, X and Y are indicated) I think that there is a reasonable indication that there is a correlation. The straight line drawn by hand through the data has a gradient of -0.19. Using regression analysis using a calculator gives T = -0.186 which is very close!

Now we can use this to apply a correction to our magnitude estimates for the variable Z. One big problem is that Z is very red in colour and so B-V is large. In fact the B-V for this star may also vary over time and any estimate may not be that accurate. The universeguide.com gives this as B-V = 1.33 for this star.

We find that for stars 84, X and Y the D(B-V) values are 0.673, 0.360 and 0.910 respectively. This gives T*D(B-V) of -0.125, -0.067 and -0.169  using T = -0.186. This makes our V estimates 7.243, 7.271 and 7.274 for Z from these stars. The mean of these values is now V = 7.262 +/- 0.017 whereas previously for uncorrected values it was 7.383 +/- 0.054. 

Note that the error has now come down and this is understandable. Some of the variation in the uncorrected estimates must come from the different colours of the comparison stars and this is taken out to a large extent by the transformation.

Looking at the BAAVSS and AAVSO databases for the night of the 2nd/3rd of April there were 11 visual observations of this variable giving 7.118 +/- 0.240. So my V estimate is 0.144 magnitudes fainter but well within the errors. It is expected that even Johnson V and visual estimates will differ for such red stars due to variations in the response of the eye compared to V.

All text and images © Duncan Hale-Sutton 2023

Friday, May 12, 2023

Messier 106 (07/05/2023)

Earlier on the night of the 7th May I took some images of the intermediate spiral galaxy M106 in Canes Venatici (the hunting dogs):-

The above picture (binned x2) was taken with a Celestron NexStar 102 SLT with a Nikon D90 at prime focus. The galaxy is in a wide (2.07x1.38 degree) field and sits just off centre to the left. North is towards the bottom right-hand corner. Unfortunately, even though this image consists of 25x30s at ISO3200 only the central portion of the galaxy is visible. There are low surface brightness spiral arms that extend out much further and the object covers something like a third of a degree (you can click on this image to get an enlarged view). The first frame was taken at 21:54 UT and the last at 22:16 UT and so just before the end of astronomical twilight. The images were processed in DeepSkyStacker and Photoshop.

Other galaxies can also be seen on this image, in particular NG4217 which sits close to a group of foreground stars at the lower left of the picture. There is also NGC4248, NGC4232 and NGC4231 which lie closer to M106. A crop of the original unbinned image is shown below:-

I have processed this to show some hint of the low surface brightness spiral arms that extend to the upper left and lower right. The galaxy NGC4248 can be seen at lower left. A more visible spiral arm of M106 can be seen emerging from the central regions at the 5 o'clock position.

All text and images © Duncan Hale-Sutton 2023